Troubleshooting#
This page provides information on how to troubleshoot certain issues with Inmanta LSM in an efficient way.
Deployment failure#
This section describes what should be done when one of the resources of a certain service instance fails. First we explain how deployment failure can be detected. The second section describes how a root cause analysis can be done via the Web Console, the CLI and the API.
Detect deployment failure#
The easiest way to detect deployment failure is by looking at the state of a service instance. When the lifecycle of a service instance is modelled in such a way that the service instance enters a certain state when failure occurs, it will be easy to detect failure by looking at the state of the service instance. In the figure below, the service instance entered the failure state which indicates deployment failure.

Determine the root cause of the deployment failure#
The root cause of a deployment failure can be examined via three different interfaces: the Web Console, the Inmanta client and the rest API. Each of the sections below discuss the procedure for a specific interface.
Web Console#
The resources that should be deployed to trigger a resource-based transfer for a specific service instance, can be obtained via
the inventory of that service instance. The figure below shows an entry in the service inventory which contains service
instances of the service type vlan-assignment. The service instance is in the state failed which indicates that a
deployment failure has occurred.

Click on the Show Resources button to get an overview of the different resources which are part of the
resource-based transfer. This overview shows each resource, together with its deployment state. The example below only contains
a single resource with the deployment state failed.

When a resource ends up in the failed state, more information on the root cause of the failure can be obtained via the Jump To Details button. This button opens the Inmanta Dashboard and shows all the details of the failed resource, including the action log. The figure below shows the action log for the failed resource.

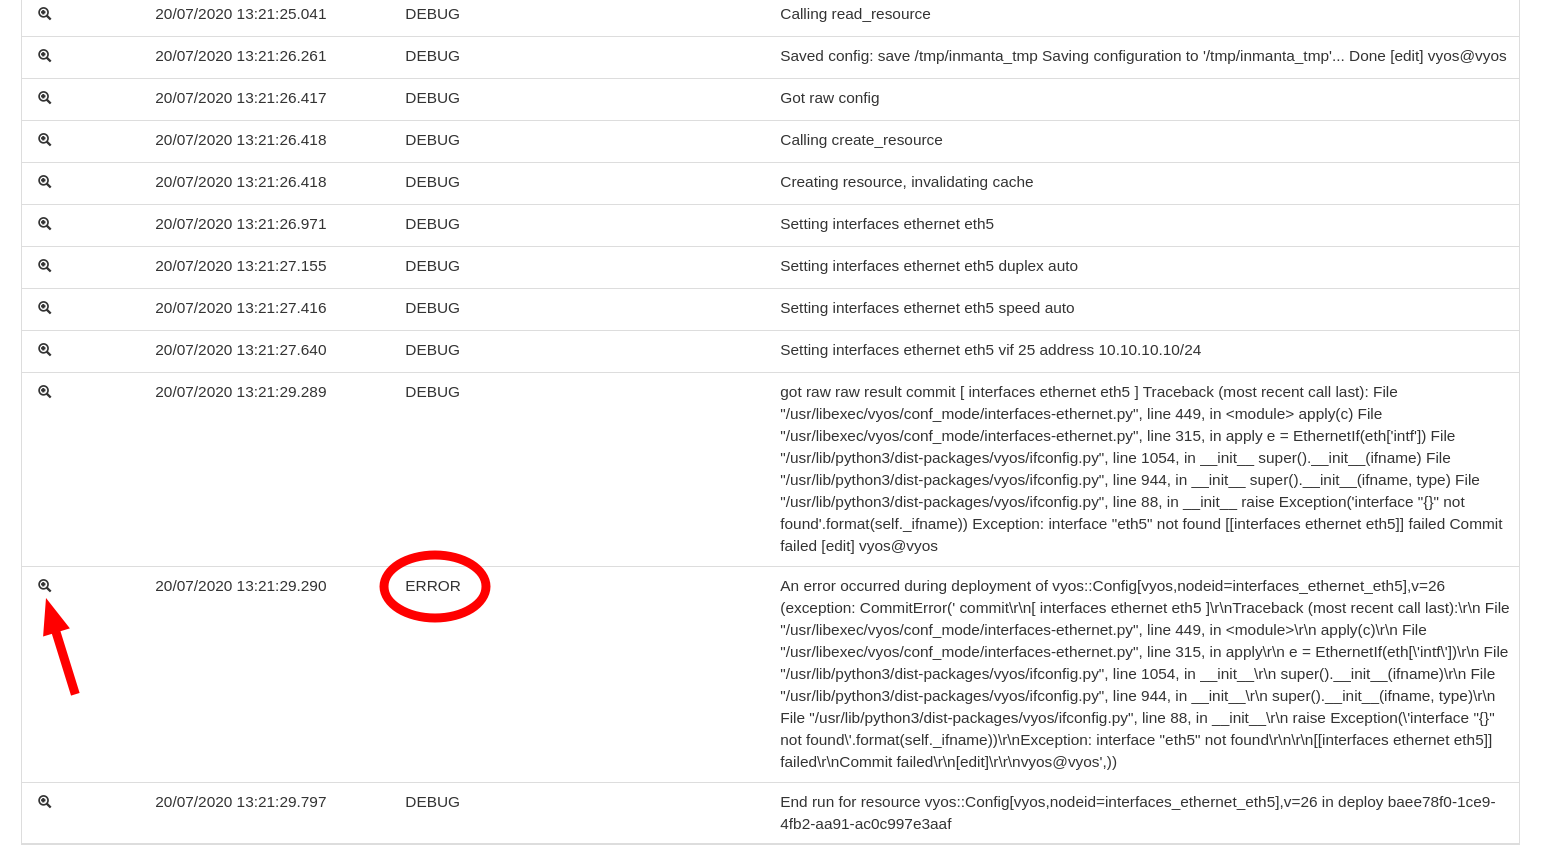
Each action in the action log can contains several log entries. Open the logs for the latest deploy action by clicking on the arrow in front of the resource action. These log entries are produced by the orchestrator itself as well as by the handler performing the deploy operation for that specific resource. The figure below shows the log entries for the deploy action.

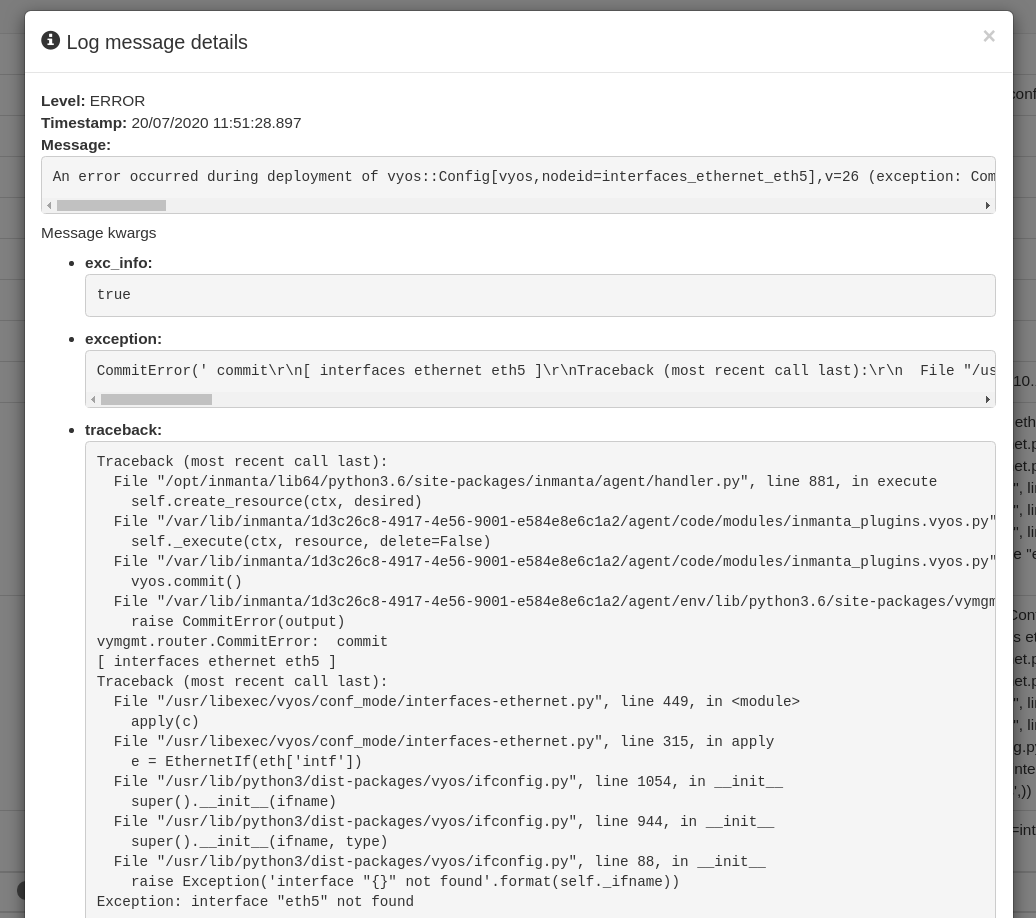
The log entry with the log level ERROR gives information about what went wrong during the deployment of the resource. Click on the magnifying glass in front of the log entry to get a full stack trace of the error.

Inmanta client#
The lsm_services_diagnose API method returns a diagnosis for a given service instance. It contains among others an overview of errors during the validation compile that caused the rejection.
Rest API#
The http://<host>:<port>/lsm/v1/service_inventory/<service_entity_name>/<instance_id>/diagnose endpoint returns a diagnosis similar to the one described in the previous section.
Validation failure#
If a service instance does not move through the expected lifecycle states but instead enters a rejected state, this means a validation failure occurred. This section describes how to detect and find the cause for validation failures.
Detect validation failure#
When a validation failure occurs for a service instance, it will enter a rejected state. Each lifecycle transfer may have an associated rejected state, the convention is to include “rejected” in the name of the state. All lifecycles defined in this module follow this convention. Example states are rejected, update_rejected and update_rejected_failed.
Determine the cause of the validation failure#
This section documents two ways to find the exception that caused the validation compile to fail. The first uses the Inmanta client from Python code, the second uses the REST API directly. The general procedure is the following: first, find the latest event (according to the timestamp field) for the current version with a compile id. Then use that id to pull in the compile report. Then, for the error message look at the report’s compile data. For a trace look in the report for the error stream for the compile stage that failed (return code other than zero).
Inmanta client#
The lsm_services_diagnose API method returns a diagnosis for a given service instance. It contains among others an overview of relevant resource failures.
Rest API#
The http://<host>:<port>/lsm/v1/service_inventory/<service_entity_name>/<instance_id>/diagnose endpoint returns a diagnosis similar to the one described in the previous section.